SuperDARN radar
The Svalbard SuperDARN Radar, located on Brienosa is an over the horizon ionospheric radar system. It is part of the SuperDARN international network of more than 30 high frequency (HF) radars designed for studying high-latitude plasma convection driven by interactions between the magnetic fields of the Sun and the Earth.
active

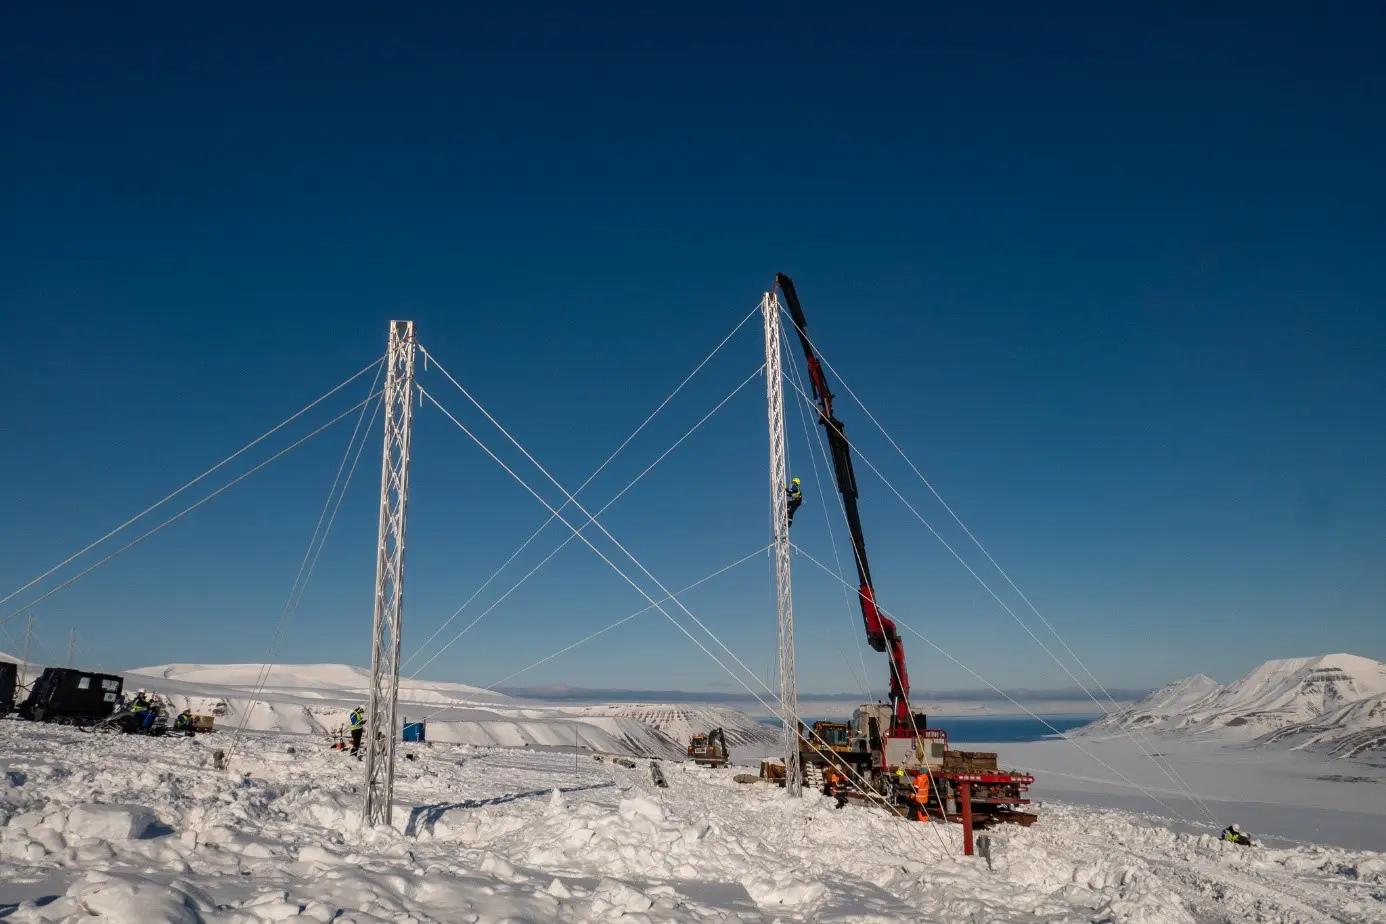
SuperDARN radar at the top of Breinosa. Photo: Mikko Syrjäsuo
About the project
The Svalbard SuperDARN (Super Dual Auroral Radar Network) Radar, located on Brienosa near the KHO and EISCAT facilities is an over the horizon ionospheric radar system. It is part of the SuperDARN international network of more than 30 high frequency (HF) radars designed for studying high-latitude plasma convection (the horizontal motion of the atmosphere at ~220km altitude) driven by interactions between the magnetic fields of the Sun and the Earth. In addition, the radar also makes measurements of the plasma turbulence, which is a signature of the energy transfer into the ionosphere.
The radar data are also useful for other purposes such as monitoring meteor impacts on the atmosphere, observing atmospheric gravity waves (at ~80km altitude) and monitoring atmospheric conditions that can cause radio communications problems. The SuperDARN radars make continuous, synchronized measurements (1- or 2-minute temporal resolution) across both the northern and southern polar and mid-latitude regions. The radars each have a field of view of ~3 million km2.
The Svalbard SuperDARN radar has 16 beams, which combine to enable a field of view to the North East of Svalbard, covering the region from Svalbard and out across the polar cap – almost extending to the northern cost of Alaska (as can be seen by the red shaded area in figure 1). As such it fills an important gap in the spatial coverage of SuperDARN and complements the local optical and radio observations from KHO and EISCAT. Collectively, the SuperDARN radars provide coordinated observations of global scale plasma structures and dynamics. The radar is funded through the Arctic Approach Research Project, by ConocoPhillips and Lundin.
The radar consists of three elements – a main array of 16 towers, each 20 meters high arranged in a line almost 300 m long, a secondary array of six towers in a 125 m long line placed 100 m behind the main array and a 20 ft shipping container placed between the two. The transmitters are housed in the shipping containers and the antennas are mounted between the towers. The radar was operational from 2016 – 2018, before an unusual storm caused heavy icing on both antenna arrays. This caused both arrays to collapse. The system became operational again fall 2023, and is currently operating in a commissioning phase, with no public data.

Data
Data from the Svalbard SuperDARN radar are fed into two two open-access repositories (a username and password are required to access the system):
- Globus: https://www.globus.org/
- British Antarctic Survey: https://www.bas.ac.uk/project/superdarn/#data.
The SuperDARN community maintains two software packages to support scientific research:
- Radar Software Toolkit (RST), the primary SuperDARN data analysis software
- pyDARN, a python library for SuperDARN data visualisation
These open source packages are maintained and distributed by an international team of scientists, engineers and software developers. In addition, a web-based interface for visualising the radar data is available from Virginia Tech: http://vt.superdarn.org/tiki-index.php
Real-time data from the LYR SuperDARN radar can be found here: https://kho.unis.no/SD/SD.htm


Figure 1: Fields of view of the SuperDARN radars in the Northern hemisphere (left) and Southern hemisphere (right). The Svalbard SuperDARN Radar field of view is shaded red. The two radars in Finland and Iceland that provide coverage over Svalbard are shaded grey (taken from Baddeley et al. 2020).


Acknowledgement of SuperDARN data
Any publications using SuperDARN Data must include the following text, outlined in the PI Agreement, in their acknowledgements:
“The authors acknowledge the use of SuperDARN data. SuperDARN is a collection of radars funded by national scientific funding agencies of Australia, Canada, China, France, Italy, Japan, Norway, South Africa, United Kingdom and the United States of America.”
During your study, if using data from individual radars only, please contact the Principal Investigator (PI) of that radar about potential co-authorship. A list of radars, institutions, and their PI’s information can be found here.
External project links:
RiS link
SIOS link
Baddeley et al. 2020 (from SESS report)
Project leader: Dag A. Lorentzen, Professor, Space Physics, SuperDARN PI