What happened to the glacier?

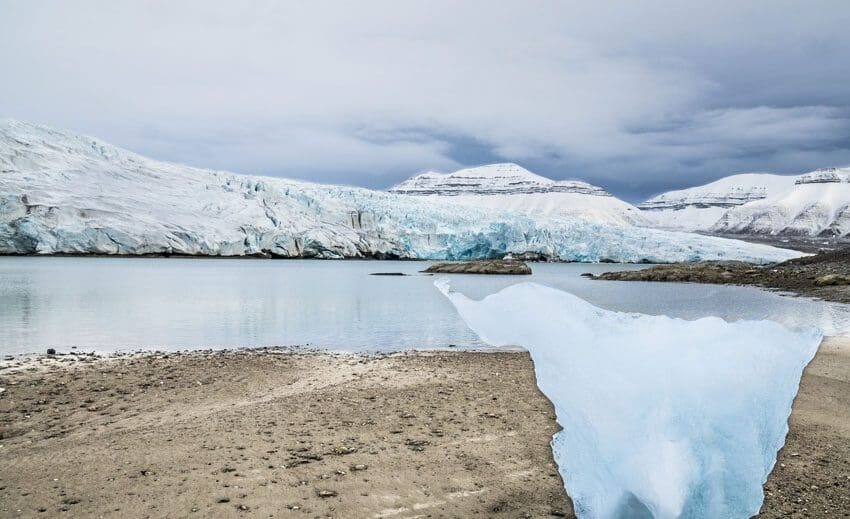
Nordenskiöldbreen 2015. Photo: ©Solvik Photography.
Top image: The area of investigation – Nordenskiöldbreen in Adolfbukta, Billefjorden. Photo: ©Solvik Photography.
Suspicious tracks have been observed in the area in front of Nordenskiöldbreen in Svalbard. Can glacier detective Lis Allaart solve the riddle?
26 April 2017
Text: Lis Allaart.

This is part of the annual dissemination competition run by the online geoscience magazine Geoforskning.no. Lis Allaart’s contribution to the competition is based on the master’s thesis she completed in 2016 at UNIS and NTNU. Allaart is currently a PhD candidate at the University of Tromsø.
Mission: Nordenskiöldbreen 1896 – 2015
Place: Nordenskiöldbreen, Adolfbukta, Billefjorden, Svalbard
Event: Suspicious tracks observed in the area in front of Nordenskiöldbreen
Measures: Digital analysis of aerial photographs, field inspections in 2014 and 2015
Reporting official: Glacier detective Lis Allaart
Course of events
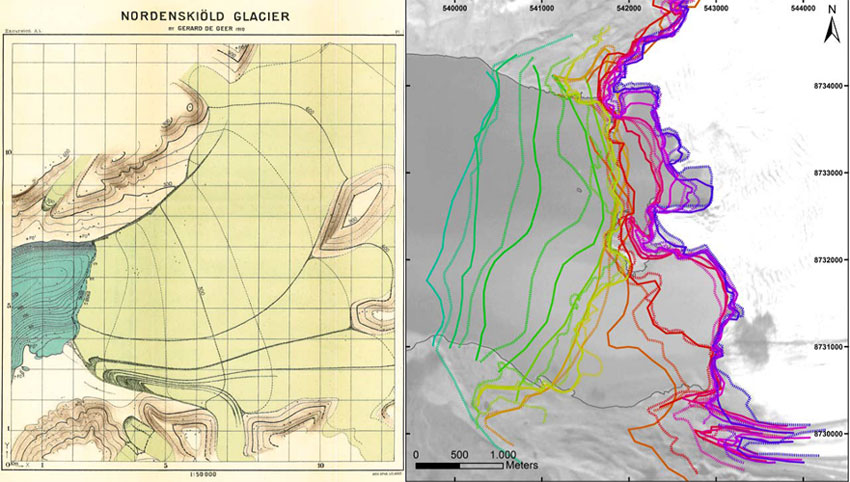
In 2013 I found an old map of the Nordenskiöldbreen (Adolfbukta, Billefjorden, Svalbard) in a book from 1910, where two different glacier front positions were marked; in 1896 and in 1910.
I also found a few aerial photographs of the area from 2009 – and there was a big difference between the glacier’s front positions from 1896 to 2009.
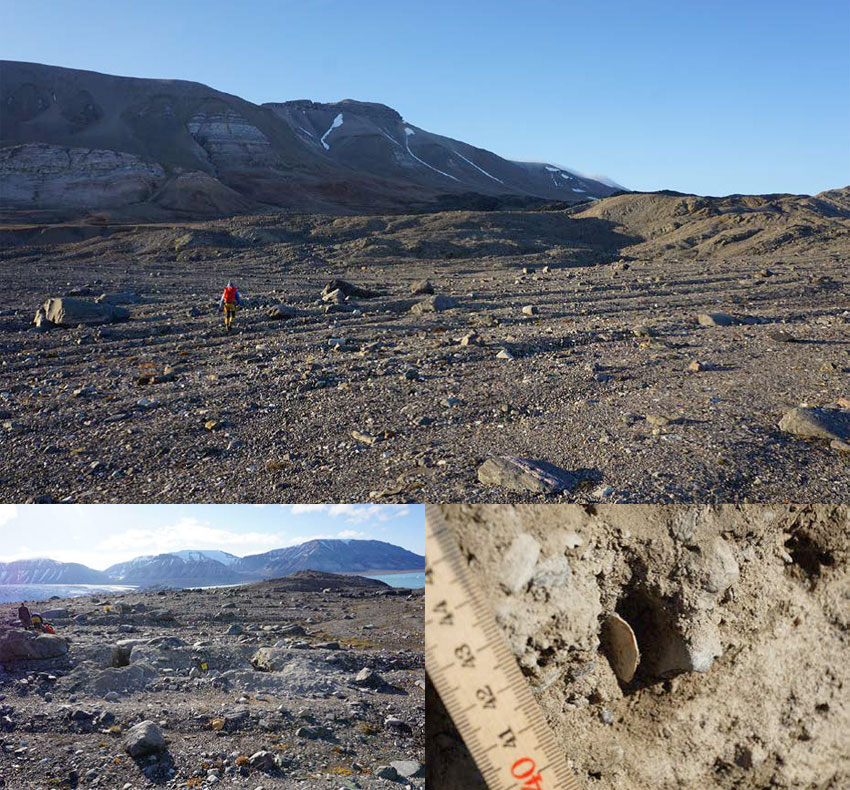
On the aerial photograph I observed many oblong stripes with a direction approximately from west to east in the area in front of the glacier on both sides of the bay.
These observations made me suspicious at once and a new mission for the glacier detective had begun: What had happened to the Nordenskiöldbreen from 1896 to today?

First, I collected all aerial photographs, old maps and satellite images of Nordenskiöldbreen I managed to find. I also received a scan of the bottom of the fjord from 2009.
The data I analysed with my glacier detection tool: ArcMap – a software where you can work with location-based data, such as GPS data or aerial images that have a specific geographic position.
I first introduced a common topographic map of Adolfbukta and Nordenskiöldbreen, which I received from the Norwegian Polar Institute. On top of this I added all the other pictures and scans of the old maps one by one.
Sometimes I had to tweak them a bit by choosing a few fixed points and then stretching them in relation to the background chart, so that all the pictures were equally large and matched with the background map. This is called georeferencing.
Then I drew up all the glacier frontlines from the various pictures and maps, each new glacier front position was further east than the previous one. In total there were 28 different glacier front positions.
The scanning of the fjord bottom and the aerial photographs from 2009 I then put together in ArcMap, drawing all the different landscapes into one map of the fjord bottom and the landscape. This is called a geomorphological map.
I followed the standards that the Geological Survey of Norway has for maps of areas in front of glaciers, so that the map can be read and understood by other glacier detectives.

To check that the digital map matched with reality, I planned a field inspection to Nordenskiöldbreen in August 2014.
In Svalbard, one must first seek permission from the Governor of Svalbard to go on fieldwork, bring all the food and equipment needed for the whole period and keep in mind that polar bears can show up everywhere – therefore you must always go with others into the field and bring rifles, signal guns and trip wire. Fortunately, two other glacier detectives wanted to join me.
For 10 days in August 2014 we investigated the landscape, checked the map, photographed landforms, kept polar bear watch and selected a pair of the oblong, low ridges and dug cross sections. Here we found various layers of sediments and mussel shells in the layers. This was suspicious since it was 25 meters above sea level and 400 meters from the current coastline.
After we returned we dated some of the shell fragments – and they turned out to be around 10,000 years old!
The south side of Adolfbukta was investigated in 2015 and the map was completed in autumn 2015.

Conclusion
The stripes in the landscape originate from the time the ice moved forward, and the various sediment layers tell us that the ice has been moving forwards several times since the end of the last ice age. The mussel shell tells us that about 10,000 years ago, there was a higher sea level and that the glacier front was farther back than it is today.
This corresponds to the fact that 10,000 years ago it was the hottest climate in modern geological times due to maximum solar radiation – a result of small changes in the Earth’s path around the Sun and the slope of the Earth axis.
From 1896 to 2015, the Nordenskiöldbreen has withdrawn 2.3 – 3.5 kilometres!
The shape of the 28 glacier frontlines indicates that the ice withdraws faster when it has water underneath it. The glacier is therefore very sensitive to sea level increases and temperature changes in the water. Many other glaciers in Svalbard, like the Nordenskiöldbreen, also have a combined front and have behaved in the same way.
The map produced during this detective assignment can be used as a background for future explorations of landscape changes as a result of global warming.
End of report.
The glacier detective 18.04.2017.