The Warm Water is Back
Over the past several decades, the world’s oceans have absorbed more than 90% of the excess heat added to the Earth through the greenhouse effect. This heat flows northward past the west coast of Svalbard via the West Spitsbergen Current—the northernmost branch of the Gulf Stream. UNIS is one of the few institutions that monitors year-round changes in water masses and the composition of biological species.

Ice core sample in Ekmanfjorden. Photo: Pernille Ottosen
By Frank Nilsen and Ragnheid Skogseth, University Centre in Svalbard (UNIS)
In today’s context of reduced sea ice cover in the Arctic and changes in biodiversity, long-term marine time series are crucial. They help improve our understanding of the effects of climate change and provide the knowledge necessary to make informed decisions for the future.

Fact box
Fieldwork on sea ice is a central part of the course AGF-211 “Air-Ice-Sea Interaction” at UNIS. The course focuses on the physics of sea ice and how it freezes and melts under various climatic conditions. This provides students with important Arctic expertise, including practical measurements of sea ice and the processes that affect it. Additionally, students examine changes in Isfjorden and the surrounding ocean. Water temperature and salinity affect the winter climate in Svalbard and the potential for sea ice formation.
Changes in Salinity
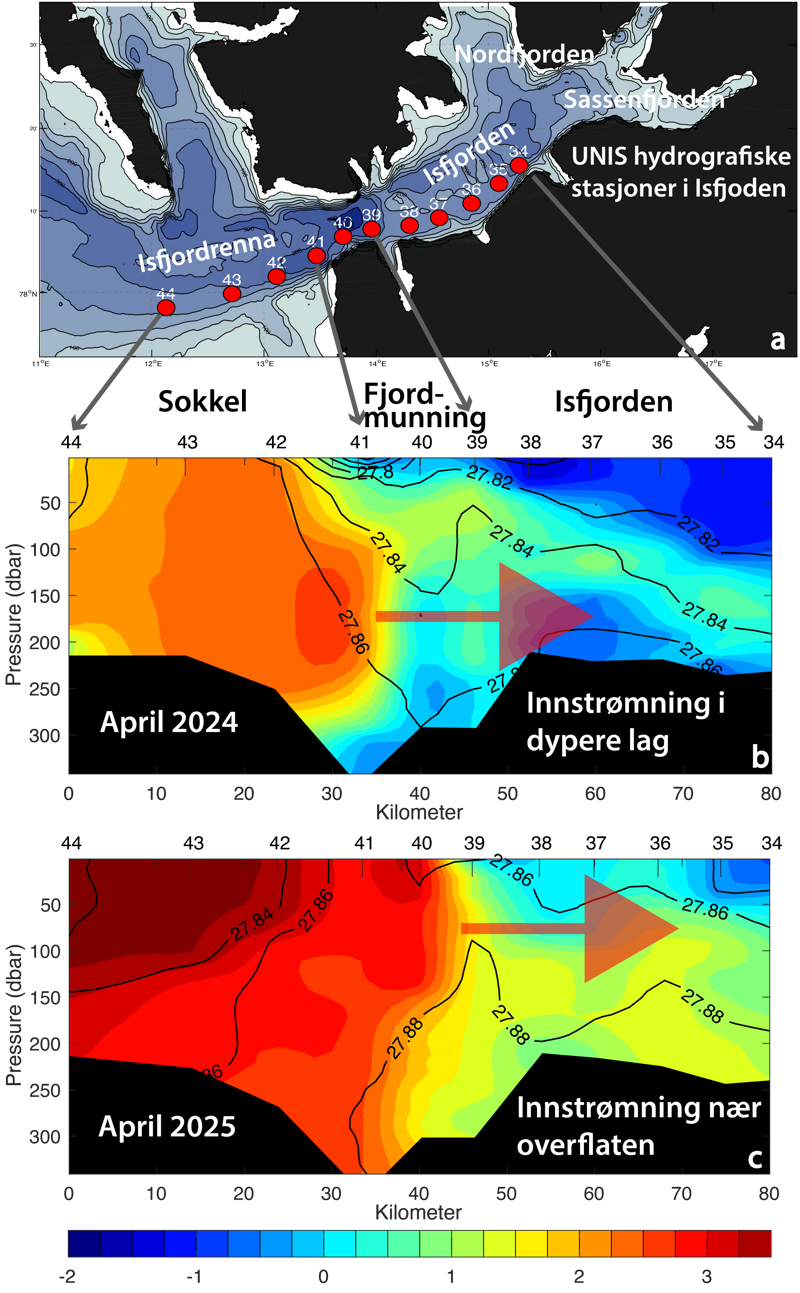
Over the last five years, water masses in Isfjorden have been fresher—and therefore lighter—than the water masses on the shelf west of Kapp Linné (Station 41 in Figure 1a), due to lower salinity, despite colder temperatures. This has caused the warm Atlantic water in the Isfjorden trough to flow into deeper layers of Isfjorden, beneath a cold and fresh surface layer that helps protect sea ice from melting. Observations from April 2024 (Figure 1b) clearly show that warm water with temperatures above 1°c is entering Isfjorden at depths below 100 meters and circulating beneath a protective cold surface layer near freezing temperature (-1.8°c). This pattern was typical before 2006 (Skogseth et al. 2020), and it temporarily reappeared in winter 2020 when there was more sea ice in Isfjorden and around Svalbard due to persistent cold air from the north. However, even though the fresher water in Isfjorden was conducive to sea ice formation over the last five winters, the atmosphere did not manage to cool the surface layer to freezing point every year, because air masses from the usual easterly and northeasterly winds were warmer than before.
Salinity in the waters around Svalbard and the Barents Sea has been declining since 2018 (Kolås et al., 2024), partly due to increased input of fresh water to the region, from more precipitation, increased sea ice melt, and melting snow and land ice. With record-warm summer months, Svalbard’s glaciers have lost vast amounts of mass, which melted and flowed into the fjords. Combined with a fresher coastal current, this has led to a dominance of fresher, though still warm, Arctic water in Svalbard’s fjord systems.
The most important reason for the reduced salinity in the oceans around Svalbard since 2018 is probably the arrival of fresher water travelling via the Gulf Stream system from the North Atlantic to our latitudes. A reduction in salinity observed in the North Atlantic began in 2012 (Holliday et al., 2020), and it took six years until this freshwater anomaly was observed around Svalbard and in the Barents Sea. A recent SESS report shows this freshwater signal in all fjords around Svalbard between 2018 and 2024.
Back to 2018 Levels
Measurements from April 2025 (Figure 1c) suggest that the salinity levels have now risen again to 2018 levels, and that warm water has intruded closer to the surface and filled the entire Isfjorden basin (Figure 1a) with warm and salty Atlantic water.
Atlantic water has once again displaced the “local” cold and fresh Arctic water. This process is known as the Atlantification of Arctic fjords and marine areas. We observed signs of Atlantification in fjord systems along the west side of Spitsbergen as early as 2006, and since then, we have demonstrated that these fjords act as indicators for what will later happen in the Arctic Ocean (Skogseth et al., 2020). Atlantification was most dominant between 2012 and 2018, when sea ice cover was absent and Atlantic cod established itself in Isfjorden. Now, it appears that Atlantification of Isfjorden has intensified again after five years of fresher water. Whether this is due to a halt in the influx of fresher water along the Gulf Stream system or due to changes in low-pressure tracks and shifting wind directions in February and March is something we are still working to determine.


North Winds “Opens the Door”
This winter, low-pressure systems more frequently hit Svalbard and entered Fram Strait to the west of the archipelago. This created southerly winds over the shelf outside Isfjorden. The usual path for these lows is east of Svalbard into the Barents Sea. This year’s wind patterns resemble those from winters between 2006 and 2018, when we experienced significant Atlantification of the fjords.
Southerly warm winds over Svalbard push Atlantic water from the warm currents along Spitsbergen’s west coast up onto the shelf and into the fjords. When the low-pressure system passes Svalbard and positions itself to the north, northerly winds blow over the archipelago. These bring cold and clear weather, but at the same time reduce the protective coastal current and “open the door” for warm Atlantic water to flow into Isfjorden.
The enormous amount of heat that now flows closer to the surface in Isfjorden and the other fjords along Spitsbergen’s west coast makes it impossible to cool the water masses to freezing point within a single winter, even if there is cold air above. Thus, the sea ice season of 2025 was cancelled already in February and March.

Could Lead to Rapid Melting
UNIS covered significant parts of the Isfjord system with temperature and salinity measurements during the teaching cruise in April and found that the entire Isfjorden was filled with warm water (Figure 1c) all the way to Sassenfjorden and Nordfjorden (Figure 1a), all the way up to the surface.
Measurements in Sassenfjorden show that the warm water continues to circulate further into Tempelfjorden and may result in warm water beneath the sea ice cover in the side fjords. We have previously seen that this can stop ice growth in Tempelfjorden. That, in turn, could lead to rapid melting of the sea ice once air temperatures rise above zero.
The snowmobile season may already be over by the time this article is read, but regardless, it is important to monitor ice thickness in well-known snowmobile routes now as temperatures begin to rise.
Reference list
Skogseth, R., Olivier, L.L.A., Nilsen, F., Falck, E., Fraser, N., Tverberg, V., Ledang, A.B., Vader, A., Jonassen, M., Søreide, J., Cottier, F., Berge, J., Ivanov, B.V., Falk-Petersen, S., (2020). Variability and decadal trends in the Isfjorden (Svalbard) ocean climate and circulation – An indicator for climate change in the European Arctic. Progress in Oceanography, 187, 102394, https://doi.org/10.1016/j.pocean.2020.102394.
Holliday P., et al. (2020). Ocean circulation causes the largest freshening event for 120 years in eastern 400 subpolar North Atlantic. Nat Commun 11: 585. https://doi.org/10.1038/s41467-020-14474-y.
Bensi, M., Nilsen, F., Ferre, B., Skogseth, R., et al. (2025). The Atlantification process in Svalbard: a broad view from the SIOS Marine Infrastructure network (ARiS). I SESS report 2024 – The State of Environmental Science in Svalbard – an annual report (s. 138–151). Svalbard Integrated Arctic Earth Observing System. https://doi.org/10.5281/zenodo.14425673
Kolås, E. H., Baumann, T. M., Skogseth, R., Koenig, Z., & Fer, I. (2024). Circulation and hydrography in the northwestern Barents Sea: Insights from recent observations and historical data (1950–2022). Journal of Geophysical Research: Oceans, 129, e2023JC020211. https://doi.org/10.1029/2023JC020211