Iwin (Isfjorden weather information network)
Providing weather data from several stations in the area, the Isfjorden weather information network aims at improving our understanding of local atmospheric processes and ultimately weather forecasts for the region itself.
active
About the project
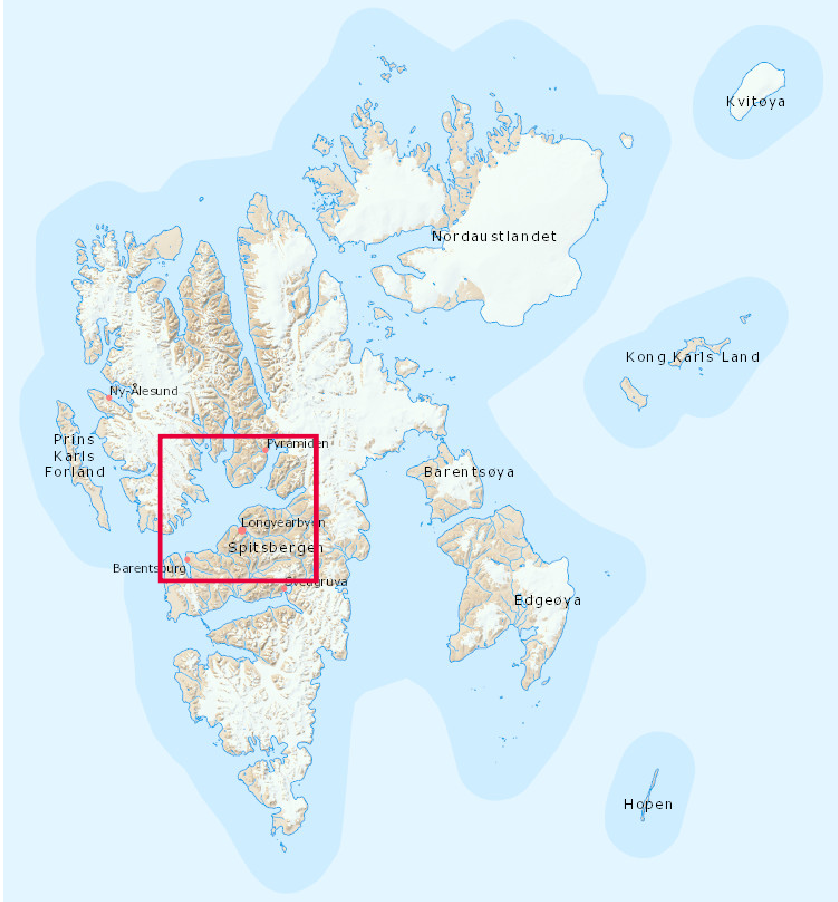
Isfjorden
Isfjorden is the largest fjord on the west coast of Spitsbergen and also the most heavily trafficked fjord in the whole of Svalbard. As for the rest of Svalbard, this activity, which is connected to among others tourism, fishery, recreational activities and science missions, has been increasing rapidly over the last couple of decades. Concurrently, the sea-ice cover on Isfjorden has undergone a dramatic reduction. This reduction, which also has implications to said human activity, has by previous research been linked to, amongst others, regional changes in weather patterns.
Human activity
The human activity in the Isfjorden region is critically dependent upon accurate weather data for the safety of people and material values. At the same time, weather data are also crucial for a better understanding of the rapidly changing, local and regional climate system.
Weather data
Weather data can come from both observations and from numerical models. On the modelling side, the Norwegian Meteorological Institute (MET Norway) has set up a dedicated local weather forecasting system covering Svalbard, the Barents Sea and parts of Northern Fennoscandia. The system is called AROME-Arctic and its weather forecasts are publicly available on www.yr.no. With a relatively high horizontal resolution of 2.5 km, AROME-Arctic provides a good overall representation of the atmospheric state over the Isfjorden system. However, weather forecasting in the high Arctic and Svalbard is challenging and forecasts are typically less accurate than for mainland Norway. Reasons include special processes and conditions connected to for example the polar day and night, complex terrain and the temporally and spatially varying presence of sea ice in the region. Another reason is the sparsity of weather observations for the improvement of our understanding of these processes, and thereby also their representation in the weather models and for assimilation into the weather models.
More weather observations are hence needed for improving the safety of human activity, for an improved understanding of the geophysical processes involved in the local climate change and also for improvement of local weather forecasts.
By providing online real-time data, the network furthermore helps to plan and conduct field activities in a safe manner.
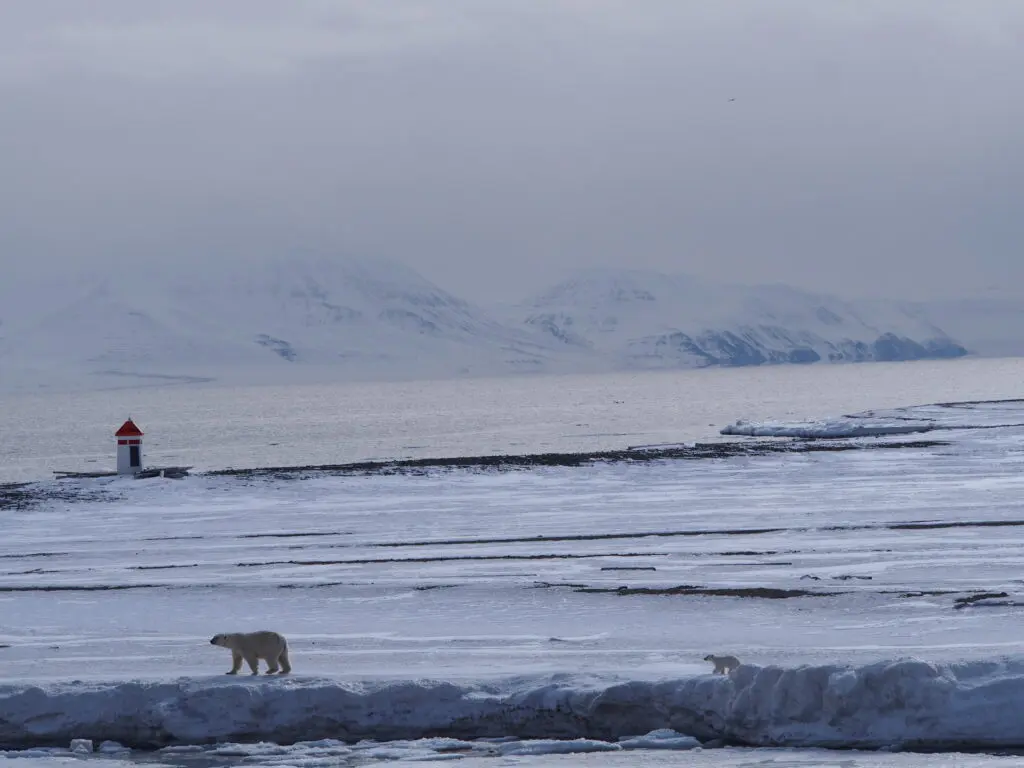
Measurements
In the Iwin-project, we are establishing a high-resolution automatic meteorological measurement network across Isfjorden. The network consists of several all-in-one weather stations deployed on lighthouse stations all around the fjord. In addition, mobile weather stations are installed onboard tourist fjord cruise ships. In that way, small-scale local variations in near-surface atmospheric wind, temperature and humidity fields can be resolved and their changes can be monitored throughout the year.
As outlined above, the so collected data do not only enhance our scientific understanding of the microclimate and air-ice-sea interaction processes the fjord area and contribute to improving numerical weather forecasting in the region, but can furthermore provide valuable information for planning and conduction of field activities in a safer manner. Therefore, special focus lies on the real-time data transfer from the stations and making the information directly available for everybody. Follow the links below to access our quicklooks of the current conditions in the Isfjorden area.
Follow the links below to access our quicklooks of the current conditions in the Isfjorden area.
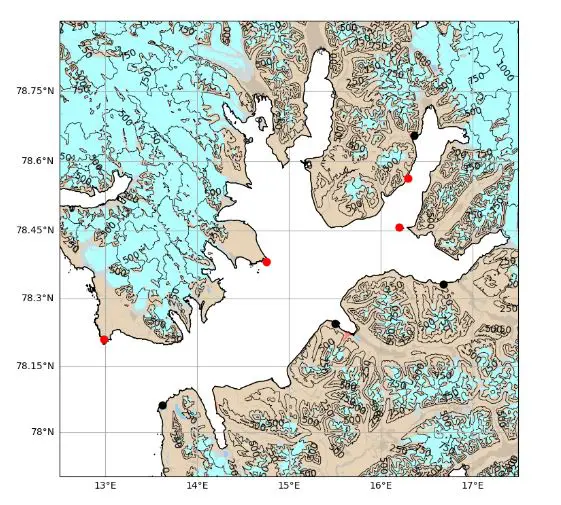
Map over Isfjorden
Onshore Weather Stations
The Isfjorden weather information network consists of several automatic weather stations, deployed on lighthouses around the fjord. Together with stations from MET Norway, this ensures 24/7 coverage of the Isfjorden area with meteorological observations.
Mobile Weather Stations

Mobile weather stations are installed onboard three tourist vessels (MS Bard, MS Polargirl and MS Billefjord). The ships follow similar, semi-regular routes from Longyearbyen towards Barentsburg, Pyramiden, Ymerbukta and Borebukta. Equipped with an internal compass and a GPS module, the wind measurements from these stations can be corrected for heading and speed of the ships. With the boat season being restricted to spring, summer and early autumn, data is available approximately from the beginning of March until the end of October.
Real time data
Both stations send real-time data as long as there is cellular network coverage. The latest data can be accessed here:
Example Data Plot
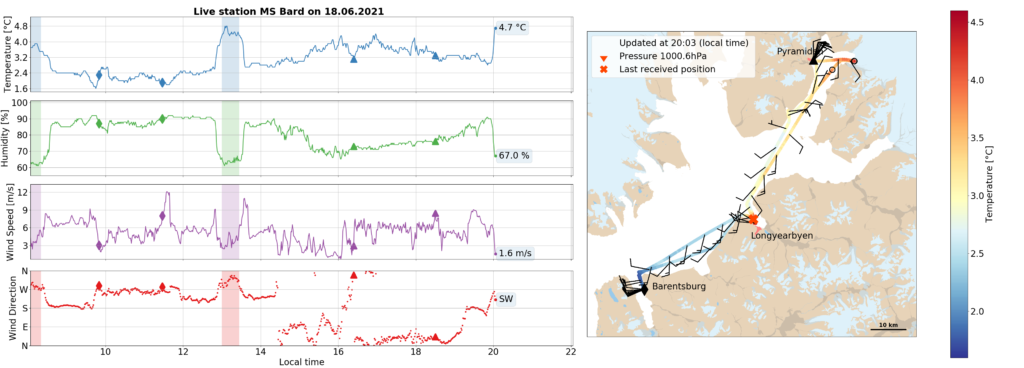
About the figure
The figure above shows an example of our live data overview from the mobile weather stations onboard the fjord cruise ships. On the left, time series of (from top to bottom) temperature, relative humidity, wind speed and wind direction are presented from the past twelve hours. Furthermore, the most recent values are displayed as a number for each variable. When the boat is located in the Longyearbyen harbor, the background on the time series is shaded (for example around 13:30 in the figure above). Possible arrival and departure from Barentsburg and Pyramiden are marked with small diamonds and triangles, respectively (not applicable for the provided example).
The ship’s track corresponding to the time series of measurements is displayed on the map on the right. Temperature is color-coded along the track, while winds are presented using wind arrows. The wind arrows point in the direction “from” which the wind is blowing. Each short barb (tail piece/flag) represents 5 knots and each long barb represents 10 knots. The barbs add up to give the wind speed. For example, 1 short barb + 1 long barb = 15 knots. Zero knots are indicated with an open circle. For conversion between units, the following is roughly true: 10 knots ≈ 5 m/s ≈ 18 km/h.
The legend (box in the upper left corner on the map) gives additional information on the last received position and update time of the plot, as well as the pressure tendency during the last 6 hours. This pressure tendency can be (but does not have to be!) an indicator for future weather changes in the sense that increasing pressure is often accompanied with improving weather, while the opposite is true for degrading weather.
Be aware that jumps (abrupt shifts) in the wind direction time series as they can be seen for example at 14:30 are due to the cyclic nature of direction (as it changes between 0 and 360 degrees), and do not indicate a real jump.
What we see
The most recent data from the MET Norway and UNIS weather stations along the shoreline is displayed in the small inset boxes.
When it comes to the scientific research questions we are addressing with Iwin, the figure above exemplifies a few interesting features: For example, we see small temperature drops in small bays close, where the measurements are impacted by the surrounding land masses. We also see a tendency for the wind direction to follow the orientation of smaller side fjords of Isfjorden, when compared to the prevailing wind direction over the bulk of Isfjorden. These are examples of features of the local micro climate in Isfjorden that will be documented and investigated within Iwin.
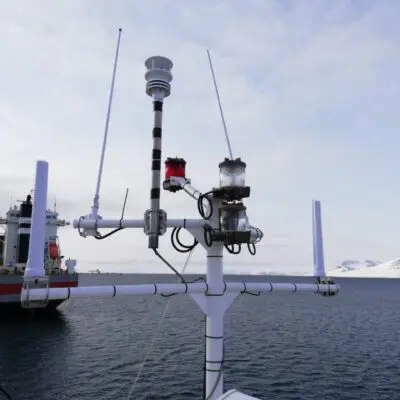
Instrumentation
The all-in-one automatic weather stations used in the Isfjorden weather information network are of the types Gill MaxiMet GMX500 and Campbell Scientific MetSens500. Both provide measurements of temperature, humidity, pressure, wind speed and wind direction at a raw temporal resolution of 1 second. Using an ultrasonic anemometer for the wind measurements, the instruments are designed without any moving parts, which implies ruggedness and long maintenance intervals. The Gill MaxiMet is equipped with an additional GPS and compass module so they can be used as mobile station on ships.
Small Environmental Impact
By making use of already existing infrastructure, measurements from remote areas are obtained at low costs, while at the same time the environmental impact of these measurements can be considered negligible. Furthermore, data-transfer via the cellular network and power supply from the deployment infrastructure (ship/lighthouse) limits maintenance to the absolute minimum, as data collection and battery swap visits are not necessary.

Partners


Remark
Both this information page as well as the data display websites are work in progress and will be updated and improved over time. We apologize for possible inconveniences caused by missing information or confusing display of content. If you have any questions regarding the project or the data, or comments/suggestions for improvement, please get in touch with us!